Kunal Chaudhari
Open to work Let's talk

(Data & ML) 2022 — 2023 · Academic project

NYC Taxi Trip Duration

Six prediction models, tested side by side, to estimate how long a taxi ride takes.

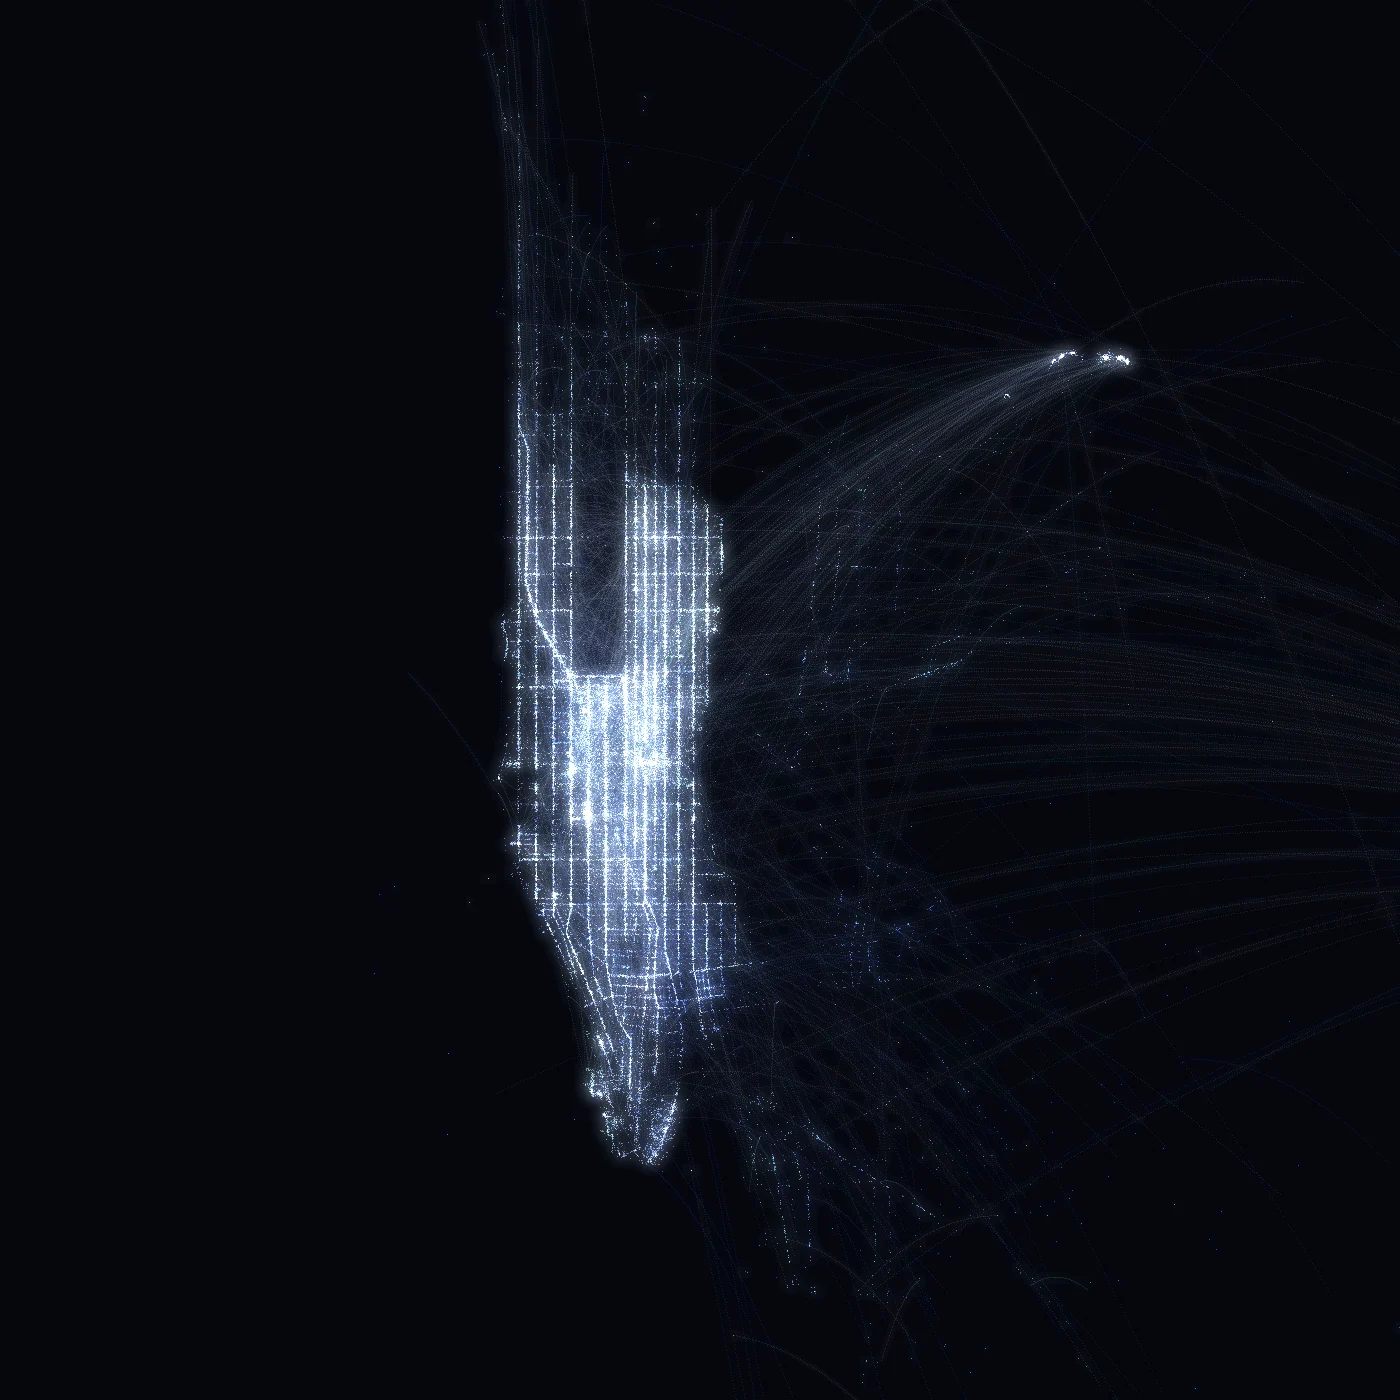
A research project on New York taxi data: cleaning it, finding patterns in pickup times, and testing six prediction models side by side to see which one guesses best.

Role
Author
Focus
Feature engineering, dimensionality, benchmarking
Status
Complete

(01) In numbers

  • 6Regressors compared

    Each scored on the same features and the same split

  • 1Null model

    The baseline every result has to beat to mean anything

  • PCAFeature space

    Components in place of heavily correlated raw columns

(02) Under the hood

From a row in a CSV to a score that means something

  1. 01 · RECORDS

    Raw trips

    Pickup and dropoff points, timestamps, passenger counts. Duration is the thing that has to be predicted from them.

  2. 02 · CLEAN

    Outliers and impossibilities

    Trips that take a day, trips that take no time at all, coordinates that are not in New York. Nothing useful is learned from any of them.

  3. 03 · FEATURES

    Derived columns

    Distance, bearing, hour of day, day of week — the things a duration actually depends on, made explicit rather than left implicit in a timestamp.

  4. 04 · PCA

    Components

    The engineered columns overlap heavily. PCA turns them into components that do not, and hands the models a smaller space to work in.

  5. 05 · MODELS

    Six regressors

    Six of them, on the same features and the same split, so that the comparison is about the model rather than about the setup.

  6. 06 · BASELINE

    The null model

    Predicting the mean, every single time. A regressor that cannot beat it has not learned anything worth having.

  7. 07 · SCORE

    The comparison

    Each regressor read against the baseline instead of against an absolute number — the only reading that says whether the features carry signal.

(03) The story

01 — The Problem

A score without a baseline says nothing

Trip duration can be predicted, but an error figure on its own is not a result. With nothing to compare against, a model that has learned the average and a model that has learned the city look much the same on paper.

  • Raw trip records with outliers that would dominate any fit.
  • Engineered features that overlap heavily with one another.
  • Six candidate models and no honest way to rank them.

02 — What I Built

One pipeline, one split, six models, one baseline

The records are cleaned, turned into features that describe a journey rather than a row, compressed with PCA, and fed to six regressors — all of them measured against a null model that predicts the mean.

  • Cleaning that removes impossible durations and out-of-range coordinates.
  • Feature engineering: distance, bearing, hour and day, from raw columns.
  • PCA to reduce a correlated feature space to components.
  • Six regressors and a null model, scored on the same split.

03 — What Changed

The comparison is the result

Every model is reported relative to the baseline, so the number that matters is how much of the duration the features actually explain — not how small an error can be made to look.

  • Each regressor is ranked against the null model, not in isolation.
  • The feature set is judged by the margin it creates over the baseline.
  • The pipeline is identical for every candidate, so the comparison is fair.
(04) Architecture

Six stages, pulled apart

  1. 01

    Records

    The raw New York taxi trip dataset, as published.

  2. 02

    Cleaning

    Impossible durations and out-of-range coordinates removed first.

  3. 03

    Features

    Distance, bearing, hour and day derived from the raw columns.

  4. 04

    PCA

    A correlated feature space reduced to components.

  5. 05

    Models

    Six regressors, fitted on the same split.

  6. 06

    Evaluation

    Every score read against the null model.

(05) Decisions

Why it is built this way

  1. (01)

    Build the baseline first

    The null model is written before the regressors, not after them. It sets the bar the rest of the work has to clear, and it stops a respectable-looking error from being mistaken for a result.

  2. (02)

    Clean before you engineer

    Features derived from impossible rows are impossible features. Cleaning comes first so that everything downstream is describing a journey that could have happened.

  3. (03)

    One split for everyone

    Six models, the same features, the same train and test split. Any difference in score is then a difference between the models and nothing else.

(06) Built with

What it runs on

A study, not a service — but the same instinct: measure against something.

For the technically curiousSix regressors benchmarked against a null model on PCA features. A prediction is only interesting once you know what doing nothing looks like. This study cleans New York taxi trip records into features that describe a journey, compresses them with PCA, and runs six regressors against a null model so that every score has something to be measured against.

PythonpandasNumPyscikit-learnPCARegressionFeature EngineeringBenchmarking